

BlogSearch Measurement
Google Search Console’s AI Reports, Explained
What Google’s generative AI reports measure, which surfaces they cover, and how to interpret impressions without mistaking visibility for traffic or sales.
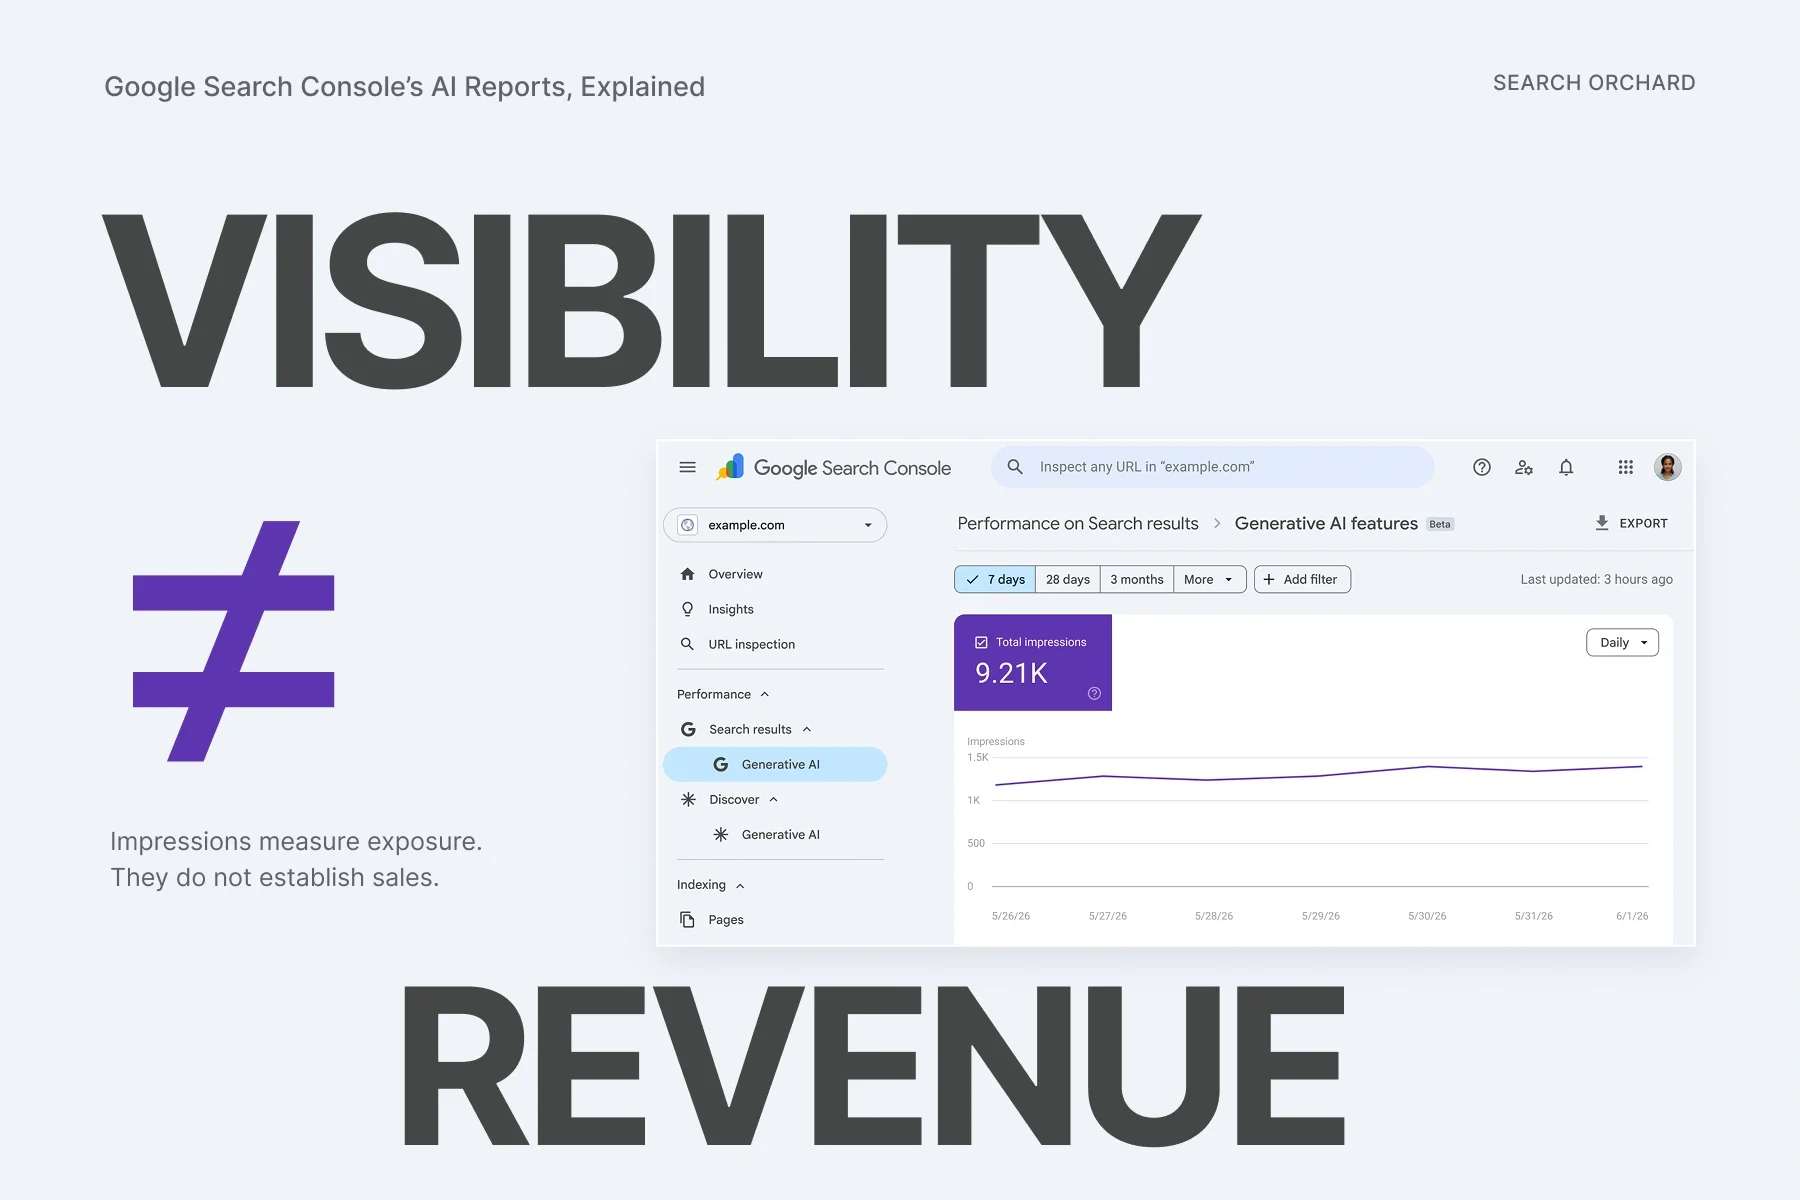
Google now gives website owners a dedicated view of appearances in its generative AI search features. That resolves an important measurement problem: some AI visibility can be examined separately. It leaves another unresolved: the report does not tell you how much business that visibility produced.
The distinction starts with the metric. The new reports show impressions, not a separate set of AI clicks, conversions or revenue. A link appearing in an AI experience is useful evidence, but it is not proof that Google recommended the business, that a person read its content or that an enquiry followed.
This reference reflects official documentation checked on 28 October 2026, including the September addition of multimodal reporting. It distinguishes Google’s Search report, its separate Discover report and the information a third-party AI visibility platform collects.
What Google introduced, and when
Google announced Search Generative AI performance reports on 3 June 2026, initially for a subset of sites. An update states that the insights had rolled out worldwide by 31 August. There are dedicated views for Search and Discover; the underlying AI performance remains included in the broader reports. The new view is therefore a way to inspect part of existing performance, not an additional channel to add to the total. Google’s launch announcement and rollout update
In Google’s published June interface example, the Search view sits under Performance → Search results → Generative AI. Discover has its own Generative AI entry. That example uses illustrative example.com data; it is not a live inspection of your property. Labels and controls can change after an announcement. The official interface illustration is a dated reference, not evidence of a particular account’s performance.
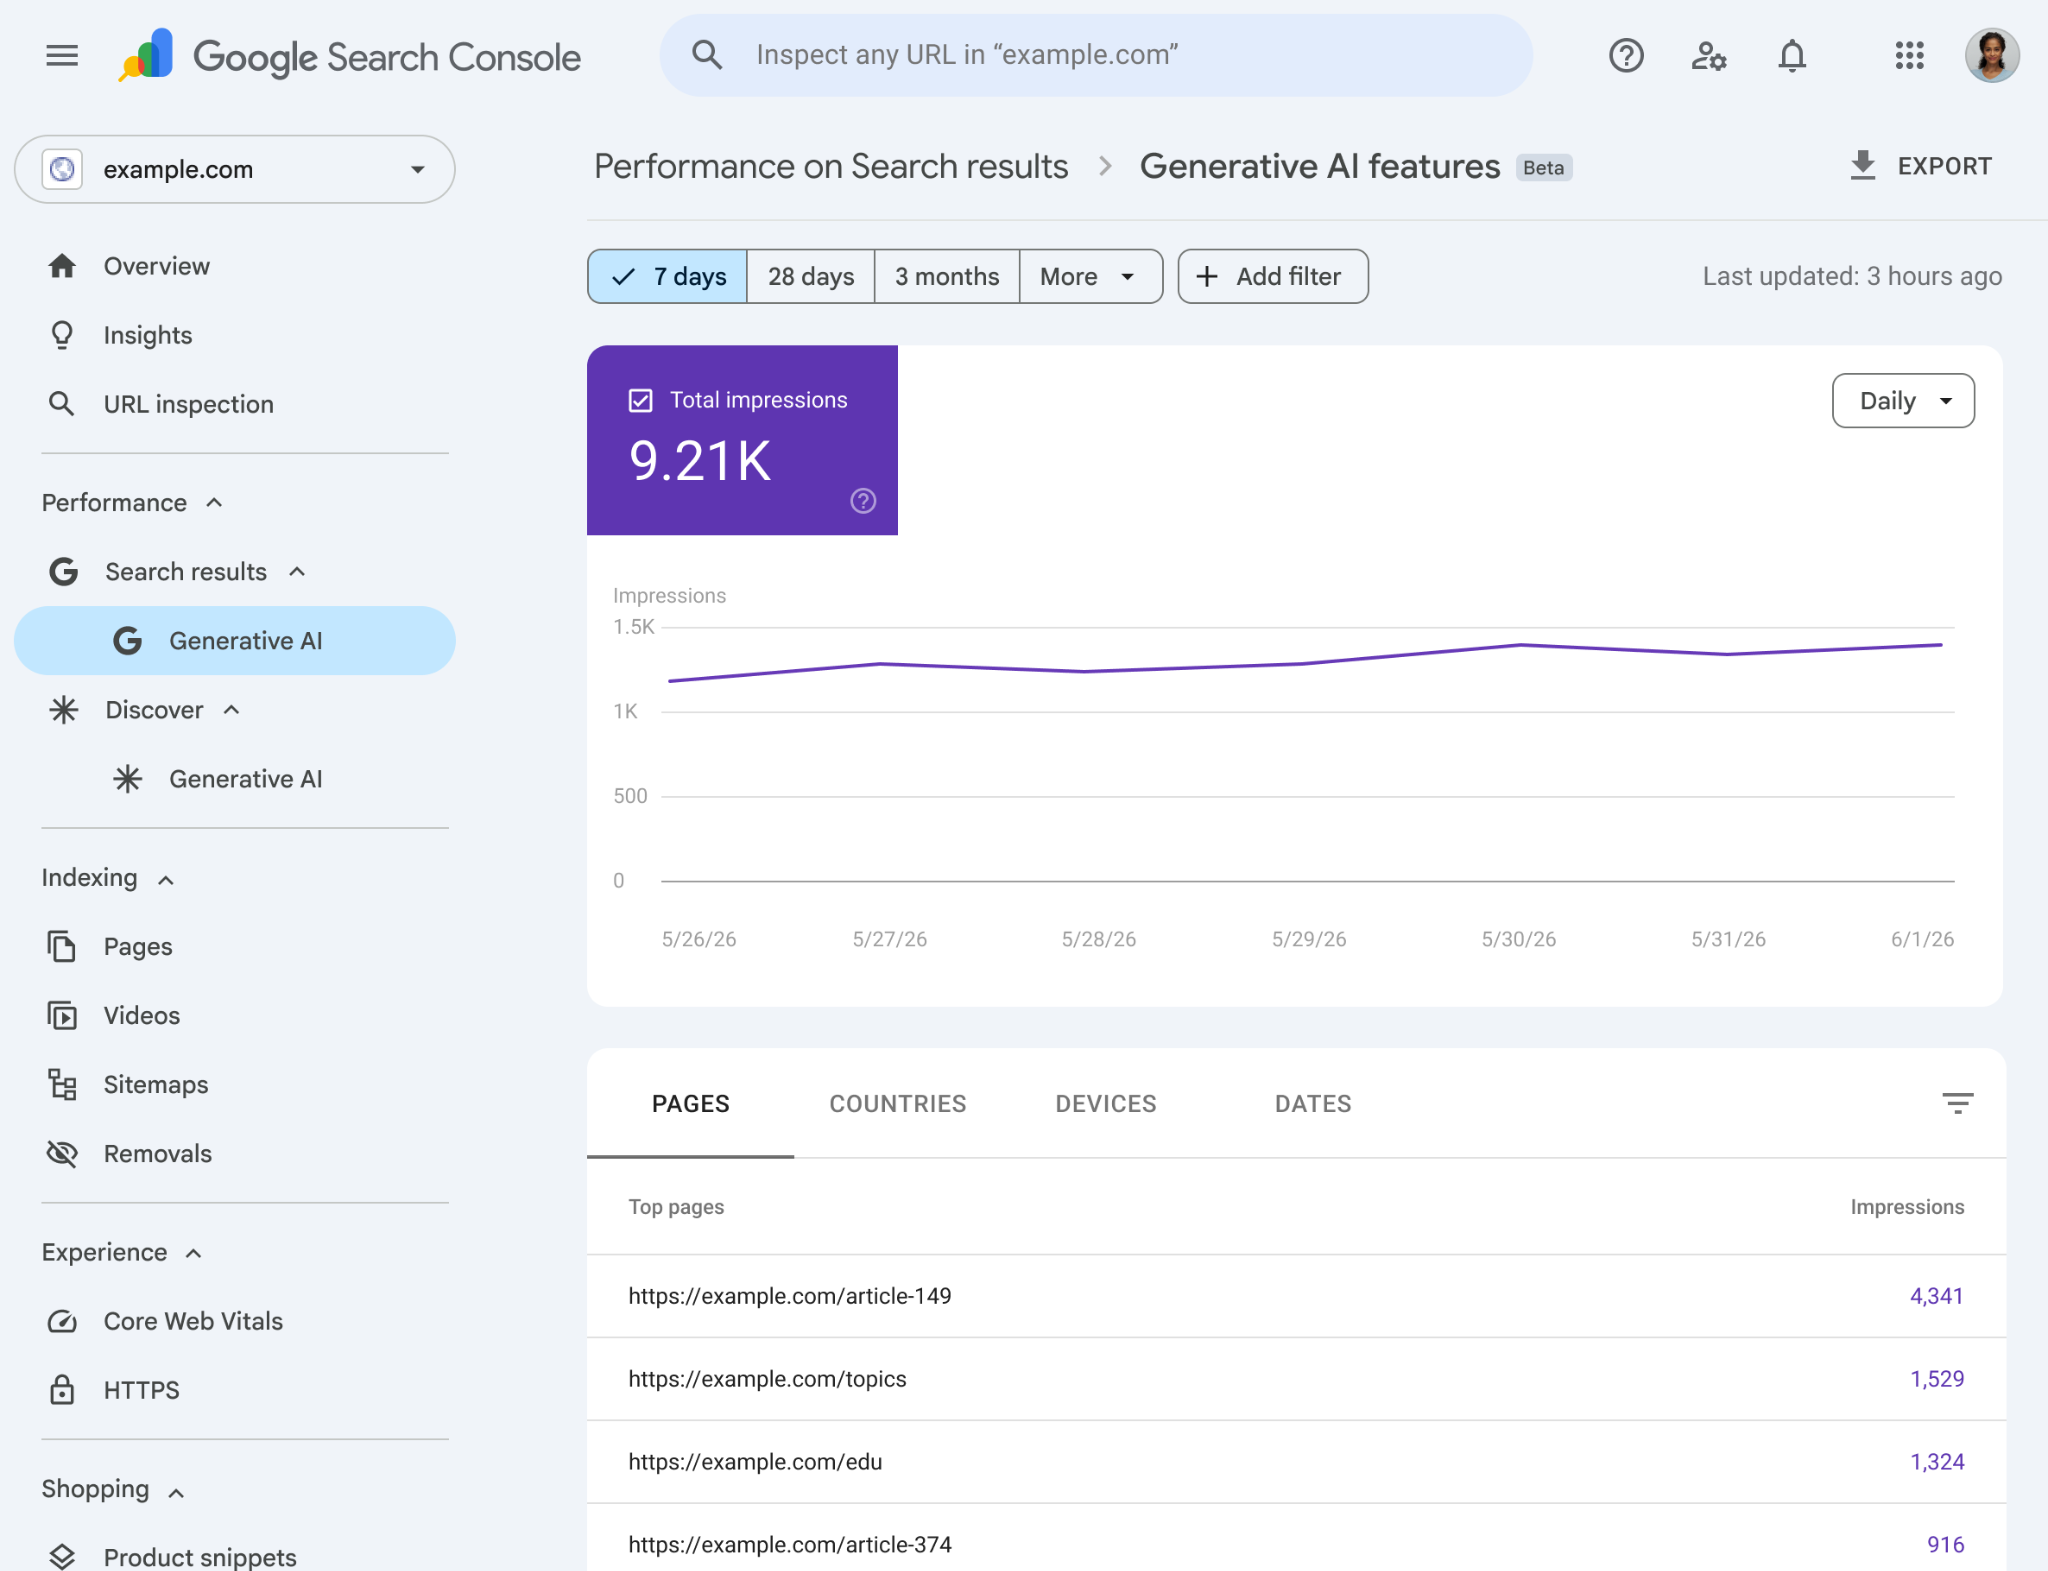
Read the interface in four parts: the navigation identifies the surface; the purple card totals the selected view; the graph describes its change over time; the table breaks that view down. Neither the card nor the table supplies a sales metric.
Worldwide rollout does not mean every property will display useful data. Google’s Search help points to insufficient impressions as a reason the report may be absent. Eligibility settings can also matter. The Discover help still contains a gradual-rollout bullet alongside the global-rollout note. That is a documentation inconsistency, not evidence of a second launch date. Search report help, Discover report help
Search and Discover cover different experiences
The Search generative report covers AI Overviews and AI Mode, with Search Labs experiments excluded. It offers Pages, Countries, Devices and Dates, plus a search-type filter. It does not document a separate AI Overview/AI Mode selector. Do not label the combined total “AI Overview impressions” alone. Search report documentation
The Discover generative report concerns AI features in the Discover feed. Its dimensions are Pages, Countries and Dates, without the Search report’s device breakdown. Discover impressions require the relevant result to enter view and count once per result per session. Its page dimension identifies the canonical source URL, which may differ from the destination reached after a click. Discover documentation
Neither report measures ChatGPT, Perplexity or other companies’ assistants. A third-party tracker asking prompts and coding answers is collecting a sample under its own method. Search Console is reporting Google’s observations of the property in supported experiences. Those datasets can complement each other, but they have no shared denominator by default.
01 / Report coverage
Two reports. Different surfaces.
Search and Discover each have a dedicated generative AI view. They cover different Google experiences, and their dimensions are not identical.
Google SearchGenerative AI
Search
AI Overviews + AI Mode
excluding Search Labs experiments
- Reported metric
- Impressions
- Dimensions
- PagesCountriesDevicesDates
- Search type
- Web: text-basedWeb: multimodal
- Aggregation
- Property-level chart; page rows use page-level counting
Google DiscoverGenerative AI
Discover
Generative AI features within the Discover feed
- Reported metric
- Impressions
- Dimensions
- PagesCountriesDates
- Device view
- Not documented in dedicated report
- Aggregation
- Page-level counting
A reporting boundary, not two new traffic channels
Generative AI activity remains part of broader Google reporting. Do not add dedicated generative impressions on top of overall totals as though they were separate visits.
Sources: Google Search generative report documentation · Google Discover generative report documentation · Multimodal reporting update, September 2026.
September added a filter that matters for product discovery
On 24 September, Google announced web multimodal reporting in both the ordinary Search performance report and the generative AI report. The search-type filter distinguishes Web: text-based from Web: multimodal. Multimodal includes Lens, Circle to Search on Android, image uploads and Chrome image search. Google’s September announcement
That can help a retailer investigate whether visual discovery is associated with a page’s exposure. It does not reveal the image a customer supplied or the full conversation. Avoid interpreting it as an AI Mode filter: input format and AI surface describe different things.
The June announcement lists hourly, daily, weekly and monthly date granularity; the current report help describes days, weeks and months. Check the controls in the actual view before promising an hourly breakdown. This difference in documentation is worth preserving in a reporting specification.
Google’s June interface illustration predates this filter and retains its original Beta label. It remains a useful record of the launch interface, but it should not be treated as a complete view of the October product.
What an impression establishes
An impression concerns a link being shown under Google’s counting rules. It is not an audit trail of everything the model read or used to compose its answer. A report row does not identify a quoted passage, demonstrate endorsement or establish that the user noticed the source.
Google’s general rules distinguish ordinary results from independently scrolling or expanding elements. Some elements require a link to be brought into view within the component. Repeatedly moving away and back during the same query or session does not necessarily produce new impressions. In AI Mode, a follow-up is a new query for reporting purposes. All links in an AI Overview share that Overview’s search-result position in the broader reporting rules. These details do not create an average-position metric in the dedicated generative report. Google’s definitions of impressions, clicks and position
The safe language in a monthly report is “recorded link impressions in supported generative features”. Calling the same number “people reached”, “answers generated using our content” or “AI recommendations” changes the meaning.
There is also no list of competitor impressions here. You cannot calculate a genuine share of the whole AI market by dividing your impressions by a denominator the report never provides.
Why the chart and page rows can disagree
The Search chart normally aggregates at property level. Two different pages from one site can therefore produce one property impression in the same result. Grouping by page can count the two URLs separately. A URL filter changes the chart’s aggregation. Search report aggregation rules
Suppose a hypothetical answer exposes links to both a supplier’s materials guide and its delivery page. The page table can legitimately give each URL a count. Summing those rows and comparing the sum with a property-level chart is comparing two aggregation units. It does not demonstrate missing data.
Google’s broader data documentation explains the same property-versus-page distinction and warns that the latest data can be preliminary. A dotted section of a chart identifies data still being collected. The export can also turn unavailable values shown as a dash or tilde into zeroes. A zero in a downloaded file therefore needs interpretation in the context of its source display. Google’s performance-data documentation
Discover uses page aggregation throughout. Applying the Search chart’s property-deduplication assumption to Discover would introduce a different error. Discover’s aggregation rules
What the dedicated report cannot answer
The current documentation presents impressions as the metric. It does not supply dedicated AI clicks, CTR, average position, queries, conversational prompts, conversions or revenue. Pages, countries, devices and dates are dimensions, not additional outcome metrics. Usual report limits, including the 1,000-row limitation, apply; dates use Pacific Time. Current Search report specification
02 / Measurement boundary
Visibility is not a sale.
The dedicated generative AI report establishes a specific kind of visibility. Other business questions require separate evidence and sometimes a different research method.
01 metric
Impressions
Recorded link appearances in supported Google generative AI experiences, under Google’s counting rules.
What question are you trying to answer?Data source / important limitation
| Business question | Where to look | What remains unknown |
|---|---|---|
| Which pages appear?Exposure in supported AI features | Generative AI reportPages, countries and dates | No complete answer transcript or evidence of endorsement. |
| Does exposure differ by country or device?Where searches come from | Generative AI reportCountry and device dimensions (Search view) | Country reflects search origin, not customer nationality. |
| Does image-based discovery matter?Text versus visual input | Search-type filterText-based / multimodal | Not the image a user submitted or their full intent. |
| Did someone visit?Traffic to your site | Overall Search + analytics | No dedicated AI-specific click or CTR total in this report. |
| Did someone buy?Leads and revenue | Analytics + CRM / orders | Attribution gaps remain; a recorded sale does not prove AI caused it. |
| Was the sale incremental?What would have happened otherwise? | Designed comparison | Requires a defensible counterfactual, not an impression total. |
Do not calculate “AI CTR” by dividing all Google organic clicks by generative impressions.
Those figures use different scopes. The dedicated report does not supply a matching AI-only click numerator.
Sources: Google Search generative report documentation · Google guidance on AI features and reporting. The decision framework follows the accompanying Search Orchard article.
Do not divide all Google organic clicks by generative AI impressions and call the result AI CTR. The numerator includes a broader set of activity. Likewise, subtracting generative property impressions from a differently aggregated total will not reliably reconstruct “traditional-only SEO”.
Google’s own AI guidance confirms that AI features form part of overall Web search reporting. The presence of a separate view does not turn the two sets into independent totals. Google’s AI reporting context
How to use the report in monthly SEO analysis
Begin with one defined comparison: the same property, page group, country, input type and completed date window. Save the export with those filters, its collection date and aggregation unit. Align timezone boundaries before comparing it with analytics; an Italian business’s local day is not the same as a Pacific Time reporting day.
Inspect which pages contribute to change. A rise confined to one information page has different implications from broader exposure across product or service pages. Compare like-for-like groups, and keep an annotation log of major site changes, eligibility changes and documented product updates. An annotation is context, not causal proof.
Then place three separate observations in the report: generative impressions; overall search traffic to the relevant pages; and the commercial outcomes recorded downstream. Describe their relationship in words. If impressions rose while enquiries fell, the data establishes divergence. It does not establish that AI answers caused the decline. Seasonality, search demand, ranking changes, site usability and tracking failures remain possible explanations.
For a new site with sparse data, a stable process matters more than a dramatic graph. Record a missing or low-volume report as such. Do not turn absence into a diagnosis that the brand lacks authority or has been excluded. Check eligibility, indexing and access directly where appropriate; an SEO audit should distinguish those checks from a visibility score.
A useful SEO consulting report explains what changed, the evidence supporting it and the decision the business can make. A larger AI impression total on its own does not provide that decision.
A better view, with a defined boundary
Google’s reports make a previously blended part of search visibility easier to inspect. They can help identify relevant pages, markets and changes worth investigating. Their value depends on keeping the unit intact.
Use them as evidence that links appeared in supported Google experiences. Use separate systems to understand visits, leads and orders. Use a properly designed comparison to investigate causes. That gives businesses a more defensible account of AI search than either dismissing impressions or presenting them as sales.
For the wider commercial context, read how AI search is becoming a sales channel. For competitive sampling outside Google’s property reporting, see why ChatGPT may not recommend your business. For why referral traffic is the wrong test of AI search, read AI search isn’t a traffic channel.